Fast Price/CmlVolume Trend Indicator
This indicator measures the strength of the faster trend (mini trend) mainly by means of special cummulative calculations of price trends and volume measurement and the behavior of the volume itself (potential buyers and sellers/supply and demand) over time.
That is, in order for the price to grow, it is necessary for capital to flow into the given asset and investors to be willing to buy the given share more and more expensively.
If there are buyers in sufficient volume who are willing to sell a given share/asset at the market price or more expensive than the current price, the offer will not dry up and at the same time there are enough buyers/investors who are still willing to buy at increasingly expensive prices, the price of the share/stock/asset grows.
If the price exceeds the level of a specially calculated combination of price and volume changes it usually means that there is more demand than supply for the stock/asset, or that buyers/investors are outselling sellers and short sellers.
Stock prices usually move in ripples/waves, and the ripples add to each other (waves are added together bigger higher trend together with faster trends). Stronger ripples/waves on a higher timeframe are usually more dominant. There is no magic or cosmic fibonacci / gann calculations behind it as many believe. Waves are created simply by the fact that, for a certain reason (news, fundamentals, reflexivity, mood, macro, growth catalyst, etc., read our articles on what drives share prices), capital begins to flow into the share/stock/asset. However, capital does not flow indefinitely, and investors will not pay more and more per share until the company’s sales continue to grow, or until it is clear that these sales/profits will continue to grow. Psychology also plays a role, if the price rises too fast, the crowd gets hungry and says to itself that the price is currently too high or has risen too fast, and the growth may or may not cool down. Also, if sellers run out, or if they are willing to sell only for more expensive limit orders significantly above the price, it can shoot the price even higher if investors/buyers are willing to pay more. If their willingness to pay such exorbitant prices is lost, growth may slow down. At a certain point, the growth and inflow of capital into the stock will slow down and the price will start to stagnate and go sideways or even down. These are the reasons why ripples are created, shorter or longer. The wave can last shorter and a correction will come, or only a small downward movement will be made and another stronger wave will occur, which will start a medium-term trend that can last for weeks, months or even years.
At the same time, large funds cannot do intraday trading with their volumes, and therefore they usually try to push the price up for days or months by gradually infusing capital, so that the public and other funds can join.

No waiting for candle close. Indicator works real-time!
In addition, this indicator works in real time, it shows the columns/lines already during their formation, and their height changes according to the current price-action. Unlike slow-motion indicators that display (or repaint) only after the candle closes and therefore cannot be relied on for real-time strategies, this indicator works in real time. Indicators that are displayed only after the closing of the candle often look very good when looking at the past, but they are dangerous because they distort the trader’s view and cannot be relied on in real time.
How we use this indicator:
This is not investment advice or guidance. We are not financial advisors. Read the full disclaimer below. These are just our personal experiences, which please take only as information and possible teaching/education.
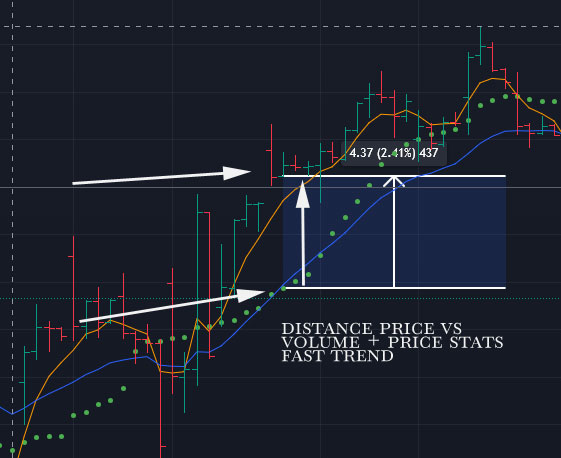
– If the price exceeds its green dots, which are a special calculation of changes in volume and price over time, it usually means that the price and volume in one direction exceed their statistical averages, and thus investors are interested in pouring capital and buying stock/asset more and more expensive.
– We (personaly in our own trading) usually go long only if the price overcomes the green dots (its volume+price)

– We also look at the price from the point of view of distance, the further it is from the green dots, the greater the pressure to buy, but if it deviates extremely, it can be considered a deviation from equilibrium and there may (or may not) be a minor correction
How we use this indicator:
This is not investment advice or guidance. This artice is only for informational, educational and marketing purpose. We are not financial advisors just data/quant analysts. Read the full disclaimer below. These are just our personal experiences, which please take only as information and possible teaching/education.
You will read these things after purchasing the full version of the indicator:
How (personally) do we use the Next indicator and what do the other lines/graphics represent and how do we understand them? On what timeframe do we use the indicator? Do we use it solo or with other indicators? With what?
On what timeframe do we use the indicator?
What stocks/assets do we (only personally) use the indicator for? (not financial advice)
DISCLAIMER / INFORMATION:
Before using this indicator or any of our strategies, you must read our full disclaimer and agree to our terms and conditions – read them here (click).