Main Trend Power & Big Volume indicator
This indicator tries to look at price, volume, priceaction and trend with the same / similar lens as WallStreet veterans and large investment funds.
This indicator measures the medium and long-term trend, the strength of the trend and likely large purchases by large institutions and hedge funds / likely large injections of liquidity.
According to the reflexivity theory of George Soros, the market participants themselves affect the very object of observation – the price, which creates a reflexive loop. That is, if the crowd sees that the price is rising, others will join the herd and others who increase the price, if they see that the price is rising, others will join (often this will also affect the fundamentals themselves, because if the price is rising for a long time, the company will get a boost, marketing hype, other investors will come, easier available capital, space in the media or better employees, the interest of new sellers and customers) this will create a reflexive loop when the market participants themselves influence the object of observation that they are analyzing. This is how a trend is created and the trend can deviate from a healthy equilibrium and the bubble burst, but the trend can also grow for several months or years in conditions close to the imaginary equilibrium. As George Soros said, it is not worth going against the crowd because there is a risk that they will trample you, it is worth going with the crowd but at the right moment to disconnect from the herd. This indicator serves exactly this purpose.
Based on the information we learned from prominent traders from WallStreet, from interviews, from books, from analyzes of their trades, etc. we have constructed this indicator that measures the strength of the trend similar to how the giants of the investment world look at opportunities.
Large investors, hedge funds, pension funds, etc. by their nature, they cannot do manual intraday trading as they manage hundreds of millions, but often billions. It is not possible to move / trade such a large capital within hours and sometimes not even within days because there are not enough buyers/sellers on the market, enough liquidity. Therefore, in order to make money, they have to wait, accumulate, pyramid their trades/deals. There are investors like Warren Buffet who buy conservative companies that have a dominant position often in industries that are necessary for normal life or the running of the economy, there you can buy, wait and pray. The problem, however, is that these stocks rarely outperform the market, but even the giants can fall, it has happened many times in history. Also, Warren often sells shares that are falling because he is probably afraid of another collapse, and his winrate is also only around 55% in certain periods of time. These stocks don’t have much to grow and surprise – what miraculous patent can a railway or a ketchup manufacturer bring, for example, to start the rocket growth of stocks? Until he brings flying trains with fuel that is almost free, we can expect nothing more than slow creeping growth, or even price stagnation.
Large funds are paid a % of profits to beat the market. For this, they must choose dynamic stocks with growth potential, but stable price action and a sufficiently large market capitalization so that the price does not jump up and down chaotically due to small purchases, but also so that the stocks can smoothly absorb liquidity injections / large purchases that these funds make. They usually don’t buy once, which would expose them to a big risk, but they buy for the first time and if the trade sees them with almost no risk, they start pyramiding positions. Read our article on almost risk-free pyramiding and investo-trading style of institutions HERE.
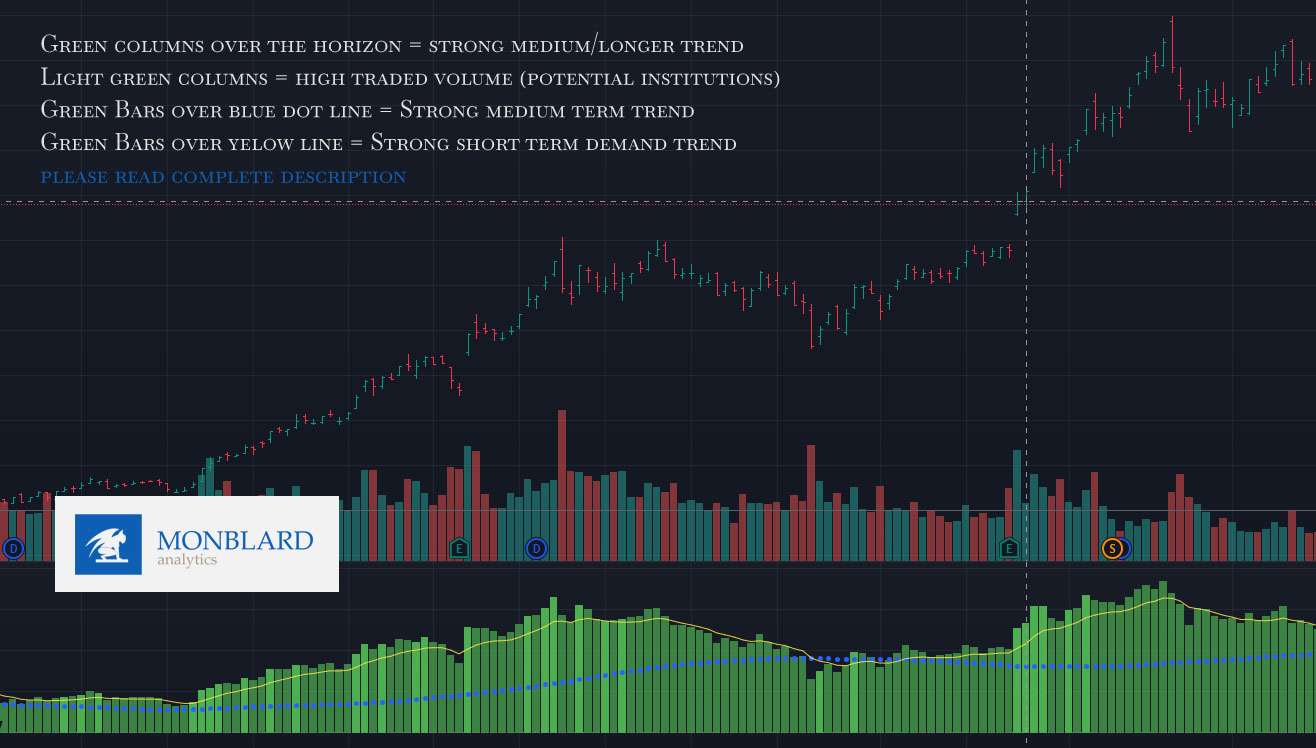
This indicator does not only measure the strength of the trend and the strength of the wave when capital flows into the asset. The indicator also directly measures the size of completed trades using a similar technique as we learned from a prominent trader who worked for one of the legends of the hedge fund industry (due to trademarks, etc. we do not mention names) – if a lighter green column appears, it is a likely sign that large volumes of business have been realized thanks to the information that the biggest players have. Although today many bg transactions are carried out through the so-called dark pools/liquidity pools outside the classic exchange market, at the end of the day all OTC orders must be entered into the book on the classic exchanges, so this large order can eventually be seen and potentially detected.
Another way this indicator can be used is to look for a possible divergence when the price is making higher highs while the indicator is making lower and lower highs (smaller peaks, smaller column height) which may mean that the bulls are running out of steam and fuel.
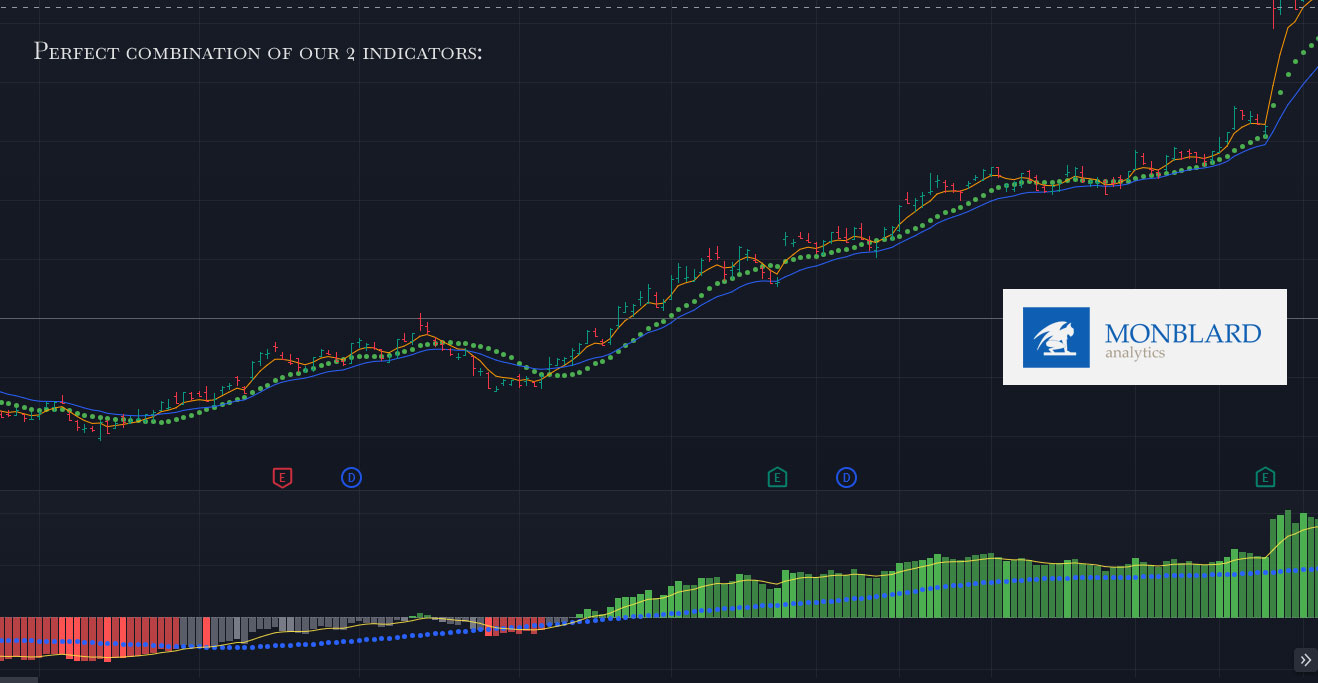
This indicator serves as an auxiliary / confirmation indicator to our other indicators and strategies, we do not use it alone but in confluence with others.
In addition, this indicator works in real time, it shows the columns already during their formation, and their height changes according to the current price-action. Unlike slow-motion indicators that display (or repaint) only after the candle closes and therefore cannot be relied on for real-time strategies, this indicator works in real time. Indicators that are displayed only after the closing of the candle often look very good when looking at the past, but they are dangerous because they distort the trader’s view and cannot be relied on in real time – when looking at the past, they showed a nice signal, but in reality it was lagging and was displayed, for example, until the next day after closing the previous candle it is a huge problem and that is why we designed this indicator for real-time rendering!
How we use this indicator:
This is not investment advice or guidance. We are not financial advisors. Read the full disclaimer. These are just our personal experiences, which please take only as information and possible teaching/education.
– Jesse Livermoore but also many others said never average down. Never buy down or never average the price down! On the contrary, catch the uptrend and the good mood of the market!
– It is our deviation and mistaken perception that we try to buy shares only at the bottom and cheaply. We have this bad habit from thousands of years of trading classic commodities such as wheat, clothing, food, gold, livestock, etc. This bad habit was probably left behind either genetically or through upbringing and education. However, it is often wrong in actions! Totally wrong! If the price is down, it is down for some reasonable reason. Investors want stocks that grow and they have a reason for that. Unlike commodities, a company is a living organism. Get rid of this mindset (buy cheap and on discount) if you want to succeed in stocks and never buy growth type of stock in a downtrend. Never!
Look at the price of an event like the price of an artist or athlete – if the artist is cheap/has a low fee, there is probably a reason for this – his fame fades and he cannot attract enough people to the concert.
You will pay a little for his fee, but you will also pay a little for the tickets or maybe you will remodel if you pay for other costs such as stage, sbs, sound, lighting and marketing. On the contrary, if you have an expensive artist, you are taking a risk, but it is likely that he will attract a record number of viewers. Of course, the most ideal thing is to pay a fee for an artist who is growing, knows how to attract crowds, his price is high but still favorable and you can get him at a discount, this way you will pay a larger amount for the fee but you will earn from tens of thousands of tickets sold, the price of tickets will rise, you will sell many drinks and meals at the concert, etc. Also look at this indicator, we (personaly in our own trading) think about buying if the price/share is in an uptrend, there are large inflows of capital and the wave is starting, but not if the wave is already falling.
How we use this indicator:
This is not investment advice or guidance. This artice is only for informational, educational and marketing purpose. We are not financial advisors just data/quant analysts. Read the full disclaimer below. These are just our personal experiences, which please take only as information and possible teaching/education.
You will read these things after purchasing the full version of the indicator:
How (personally) do we use the Next indicator and what do the other lines/graphics represent and how do we understand them? On what timeframe do we use the indicator? Do we use it solo or with other indicators? With what?
On what timeframe do we use the indicator?
What stocks/assets do we (only personally) use the indicator for? (not financial advice)
DISCLAIMER / INFORMATION:
Before using this indicator or any of our strategies, you must read our full disclaimer and agree to our terms and conditions – read them here (click).