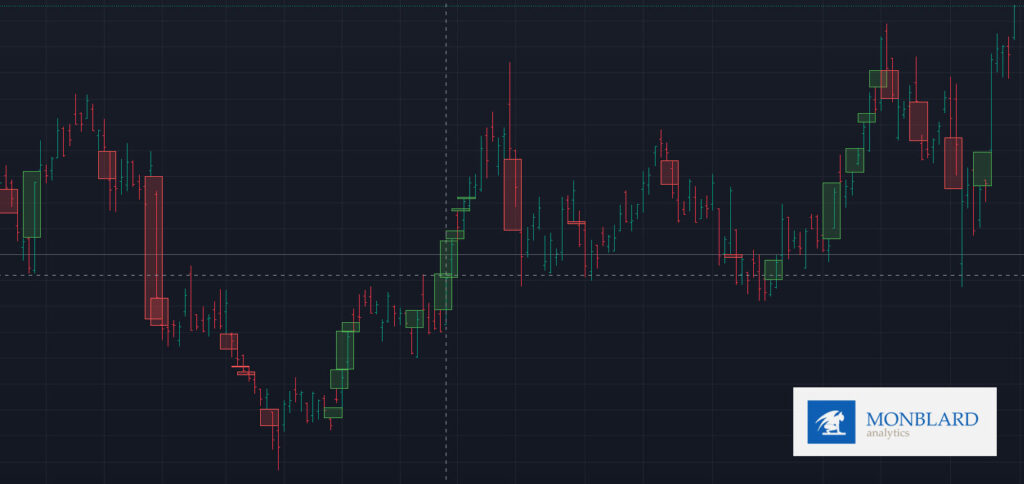
Large block / OB+VL Detector
This indicator tries to find following candles/situations (Potential Large order blocks, Volume blocks) using various quantitative candles calculations:
– when did the strong price and volume momentum occur
– momentum when a large number of orders were traded in a positive direction
– probable hidden hft orderblocks of large institutions or purchases of large institutions
Time frames are 1 day, 2 hours and 1 hour.
Green columns represent possible positive momentum and buying blocks, red columns represent negative blocks/sales.

We offer the indicator in 2 sensitivity levels for volume detection:
– Stronger when significantly large trades and momentum are detected (however, it can display them only later when the momentum and mini trend is already started, i.e. not at the beginning of the wave at full launch)
– and a more sensitive one that displays these blocks even at lower volume is more sensitive and displays more blocks and earlier, but the blocks may not always be large enough for the momentum to continue and push the “freight train”
Unlike most institutional order block search engines, the indicator does NOT repaint, so it displays the blocks immediately after closing the candle. Common OB detectors in most cases repaint – i.e. additionally redraw the order blocks even 5-8 candles or days later, which is a huge problem and the analysis deceives the trader – looking at the past, he thinks the indicator is accurate, but if he uses the replay mode, he finds out that the blocks were added to the graph additionally. Our system works in real time.
How we use this indicator:
This is not investment advice or guidance. This artice is only for informational, educational and marketing purpose. We are not financial advisors just data/quant analysts. Read the full disclaimer below. These are just our personal experiences, which please take only as information and possible teaching/education.
You will read these things after purchasing the full version of the indicator:
How (personally) do we use the Next indicator and what do the other lines/graphics represent and how do we understand them? On what timeframe do we use the indicator? Do we use it solo or with other indicators? With what?
On what timeframe do we use the indicator?
What stocks/assets do we (only personally) use the indicator for? (not financial advice)
DISCLAIMER / INFORMATION:
Before using this indicator or any of our strategies, you must read our full disclaimer and agree to our terms and conditions – read them here (click).