Macro7
Predicting the behavior of thousands to millions of people in real time is very challenging.
If you want to know in which direction the crowds of people will go, it is a difficult task. However, if you put a suitcase with money on the square, the crowd will run in that direction. If an armed person comes into a restaurant and starts shooting, about 99.9% of people panic and hide under the table. So, in specific and critical situations, it is possible to predict the behavior of large crowds to a large extent. Outside of special critical situations, the movement of crowds is often a random chaotic noise, sometimes the crowd follows the crowd and they go in one direction (this is also why some marketing companies offeres the possibility of renting the crowd if, for example, you are opening a new store – because the crowd will attract another crowd)

Paper data backtests with mechanical strategy using Macro7 Indicator, Main Trend Indicator and other minor settings, Pyramiding 25%x4:
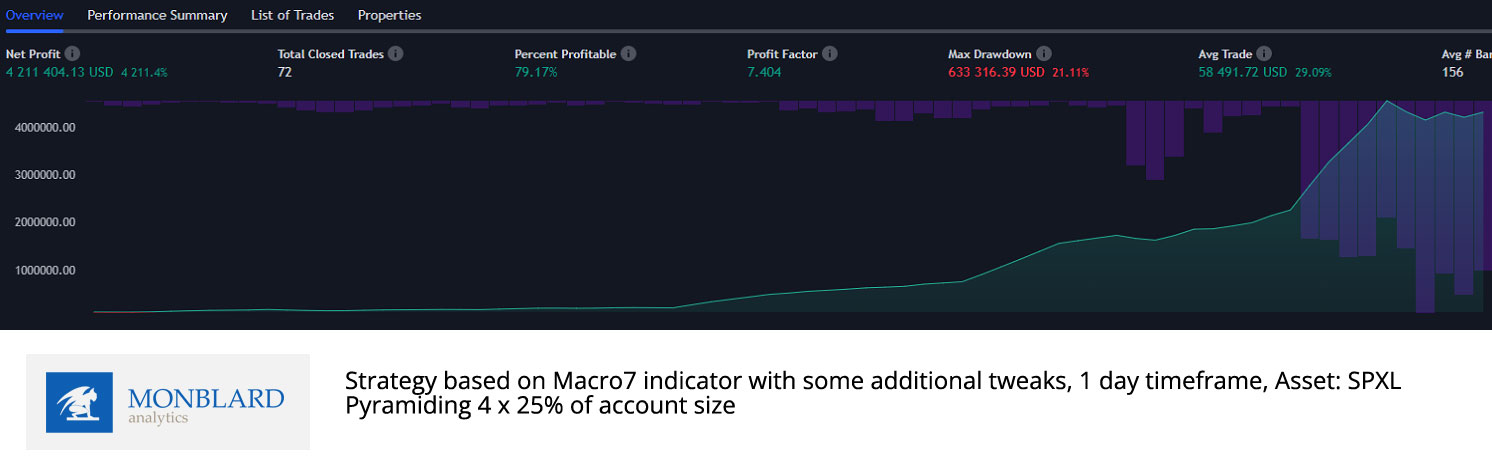
This indicator determines the possible mid-term bottom on the S&P500 and Nasdaq100 indexes, but it does not draw data directly from the price of these indexes, but from other data sources. This makes it unique with a very good ability of predictability. Its strength is also reflected in the results of its transformation into a strategy – see graphs. Since it is difficult to almost impossible to determine the exact bottom and the continuation of the future development even in a few days (who knows the future exactly?), we decided to use the 2x and 3-4x pyramiding settings in the strategy, i.e. spread the investment into 3x and buy into 3x. Nevertheless, the strategy significantly outperformed the index on past data. We also decided to add a simple uptrend filter via (Additional Main Trend Power & Big Volume indicator) when we entered trades only when the price was in a slight uptrend – the results improved significantly and the drawdown decreased.

The blue label 7 indicates a probable mid-term or short-term market bottom (when the extreme behavior of the crowds could end and a reversal could occur) with a certain statistical probability. Of course, we do not rely only on a single signal, but wait until it is confirmed by other indicators + analyzes and the price starts to grow through, for example, (Main Trend Power & Big Volume indicator, Fast Price/CmlVolume Trend Indicator), which indicates a possible rebound from the bottom.


The gray label EXT7, on the other hand, indicates a place where the trend could be exhausted and a short-term depression, correction or reversal of the trend could occur. Sometimes, however, this place is broken by bull power and a strong trend by willingness to buy more and more expensive and pour capital. Therefore, we also use other indicators and take this signal only as an informational one (usually in many of our strategies we sell a slightly larger part of the position at this point and let the part run further while carefully monitoring other indicators.)
We sometimes use the indicator as an auxiliary indicator for the purchase of large and mega cap stocks that are very strongly correlated with the macro market/indices. However, not as a buying signal only to estimate the behavior of the macro environment, we analyze the shares separately with other indicators and strategies.


How we use this indicator:
This is not investment advice or guidance. This artice is only for informational, educational and marketing purpose. We are not financial advisors just data/quant analysts. Read the full disclaimer below. These are just our personal experiences, which please take only as information and possible teaching/education.
You will read these things after purchasing the full version of the indicator:
How (personally) do we use the Next indicator and what do the other lines/graphics represent and how do we understand them? On what timeframe do we use the indicator? Do we use it solo or with other indicators? With what?
On what timeframe do we use the indicator?
What stocks/assets do we (only personally) use the indicator for? (not financial advice)
DISCLAIMER / INFORMATION:
Before using this indicator or any of our strategies, you must read our full disclaimer and agree to our terms and conditions – read them here (click).