Equilibrium Bottom QA1S
Many notable investors and traders have noticed that prices oscillate around their notional equilibrium and current value. The prominent mathematician Benoit Mandelbrot (you certainly know the Mandelbrot fractals) is said to have been commissioned by the Egyptian government to calculate what affects the price of cotton. He found that the price oscillates around its real value over time.


In his famous theory of reflexivity, George Soros talked about the conditions when the price oscillates around its equilibrium and distinguished between the states when the price is in conditions close to equilibrium (near equilibrium conditions) and when it moves away from its equilibrium and a bubble may form (far from equilibrium conditions). Of course, G. Soros considered not only the price itself, the distribution of profit and loss days around the median value, but the imaginary equilibrium in his virtual “model” was also made up of other fundamental factors of the stock (p/r ratio, eps, earnings, revenue, etc.) but also macroeconomic factors (fed liquidity, gdp, etc.)
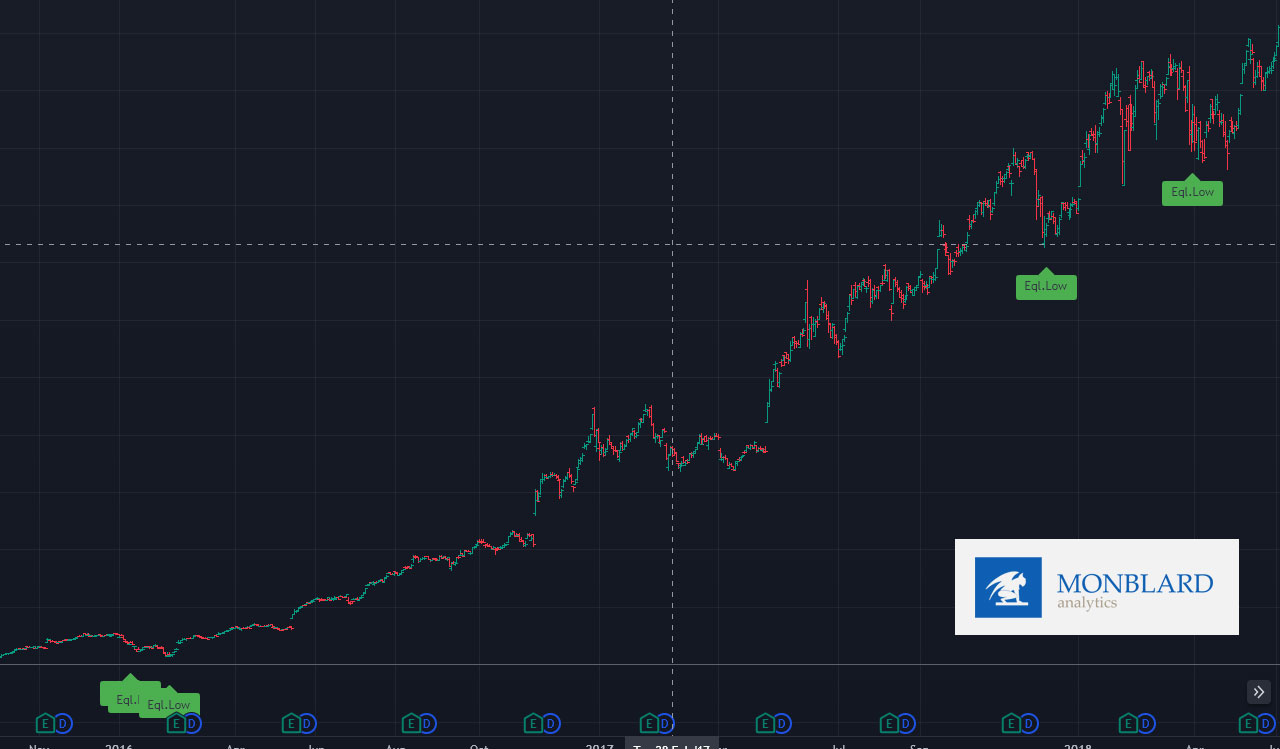
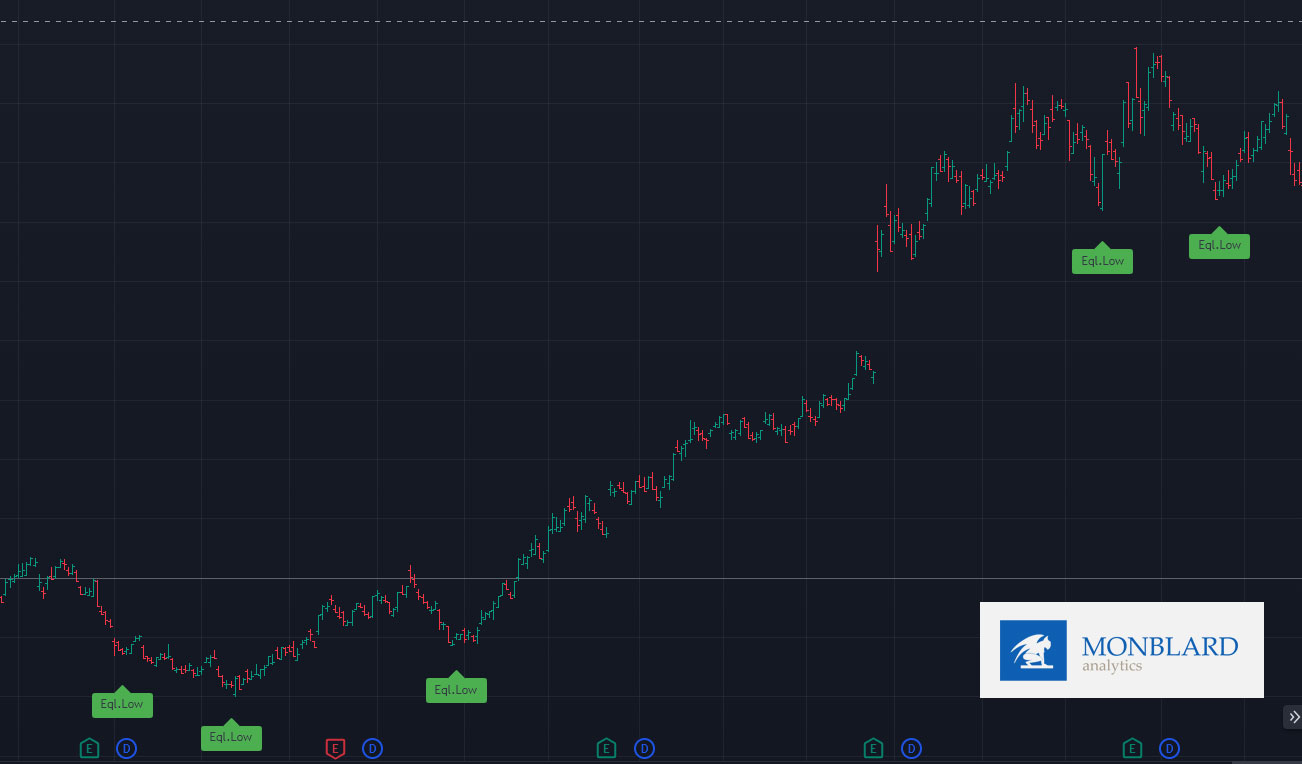
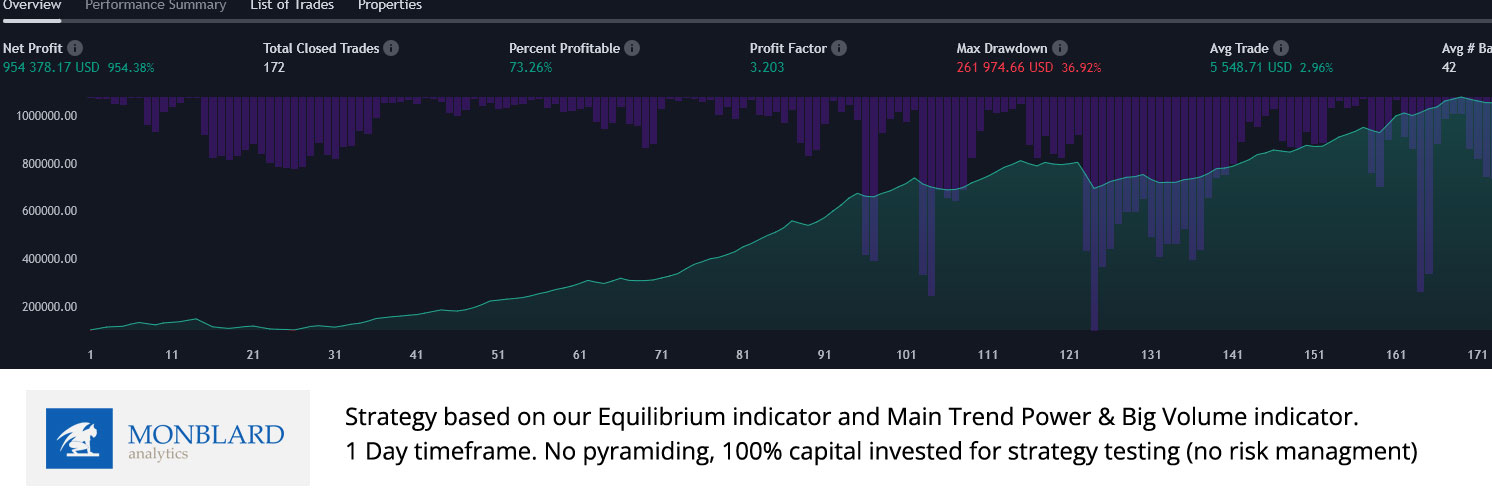
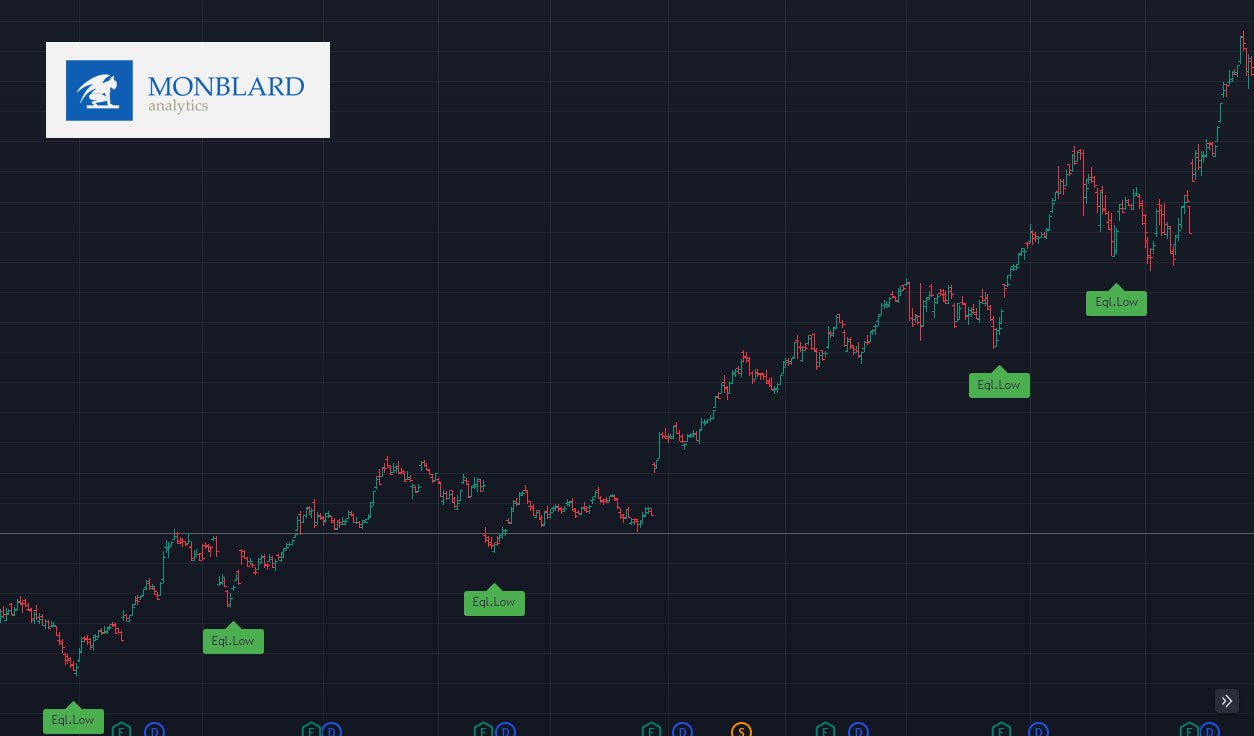
This indicator tries to find medium-term bottoms of large stocks and indexes and significant deviations from equilibrium, states when public panic reached a sharp change in trend and the price deviated significantly from its imaginary equilibrium. Sometimes it is relatively simple and the indicator can find an almost exact bottom, other times it is more difficult, especially in situations where along with the deviation out of equilibrium, the trend and equilibrium itself changes and shifts sharply, for example due to the influence of a long-term correction or recession – then it is possible that the indicator will create several deviations and possible market bottoms. That’s why we pyramid and use it in confluence with other indicators. We do not use it as a separate signal to enter, but we usually wait until the price crosses (Fast Price/CmlVolume Trend Indicator) which can be a signal that the price is starting to turn after it has already reached a significant bottom and a rebound from the exaggerated reaction of the public caused by panic when the price turned away too much from the current rational value of the share.

The indicator is designed for a 1-day timeframe and is suitable for large and mega cap stocks / blue-chip stock with normal price action and ETFs / Indices (S&P500, Nasdaq 100, DowJones Industrial etc.)
How we use this indicator:
This is not investment advice or guidance. This artice is only for informational, educational and marketing purpose. We are not financial advisors. Read the full disclaimer below. These are just our personal experiences, which please take only as information and possible teaching/education.
You will read these things after purchasing the full version of the indicator:
How (personally) do we use the Next indicator and what do the other lines/graphics represent and how do we understand them? On what timeframe do we use the indicator? Do we use it solo or with other indicators? With what?
On what timeframe do we use the indicator?
What stocks/assets do we (only personally) use the indicator for? (not financial advice)
DISCLAIMER / INFORMATION: