Total Scan D20SQ
Although this indicator may seem similar to other common indicators that only work with price or volume, it is completely different and works with a diametrically different set of data.
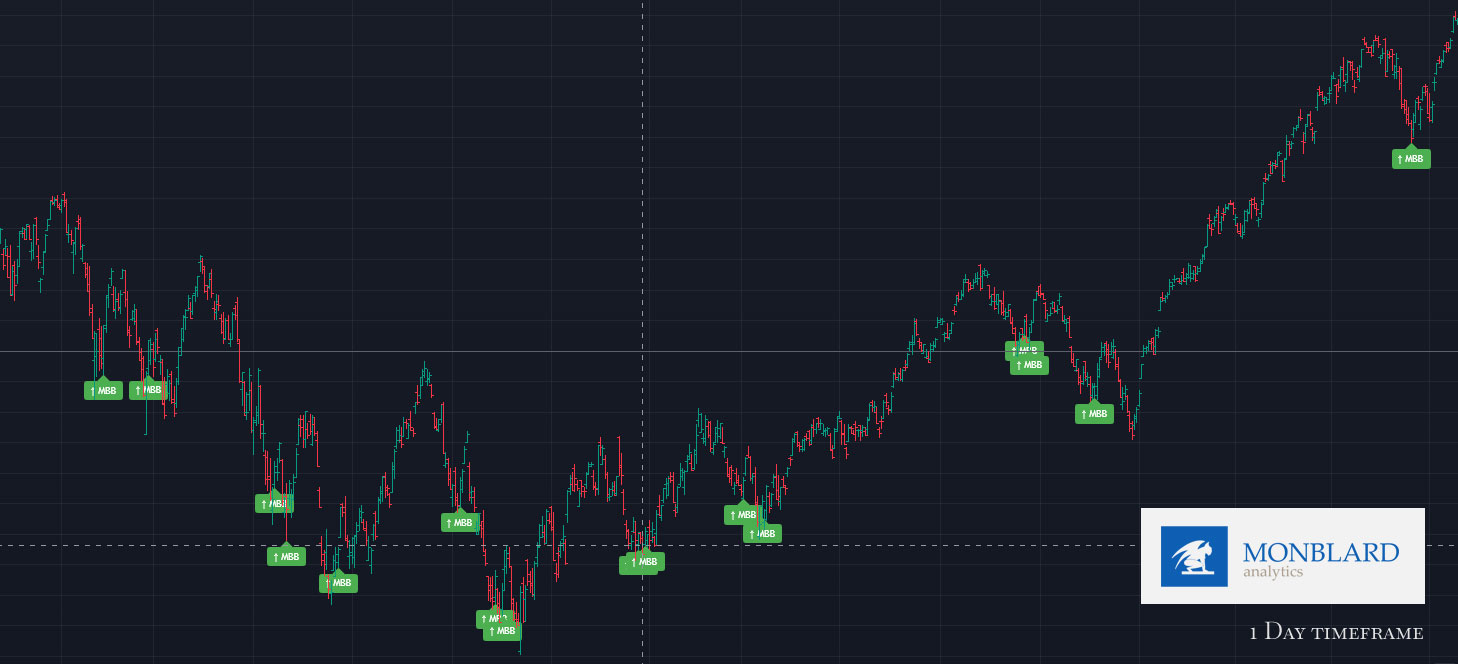
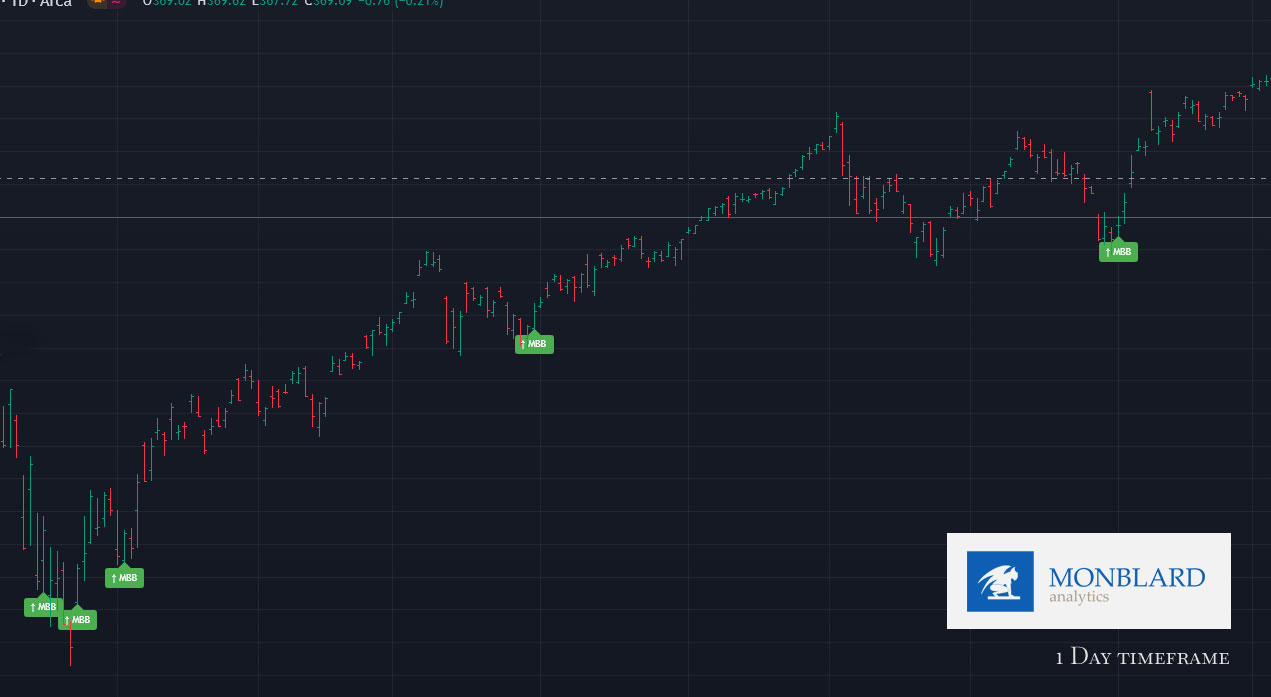
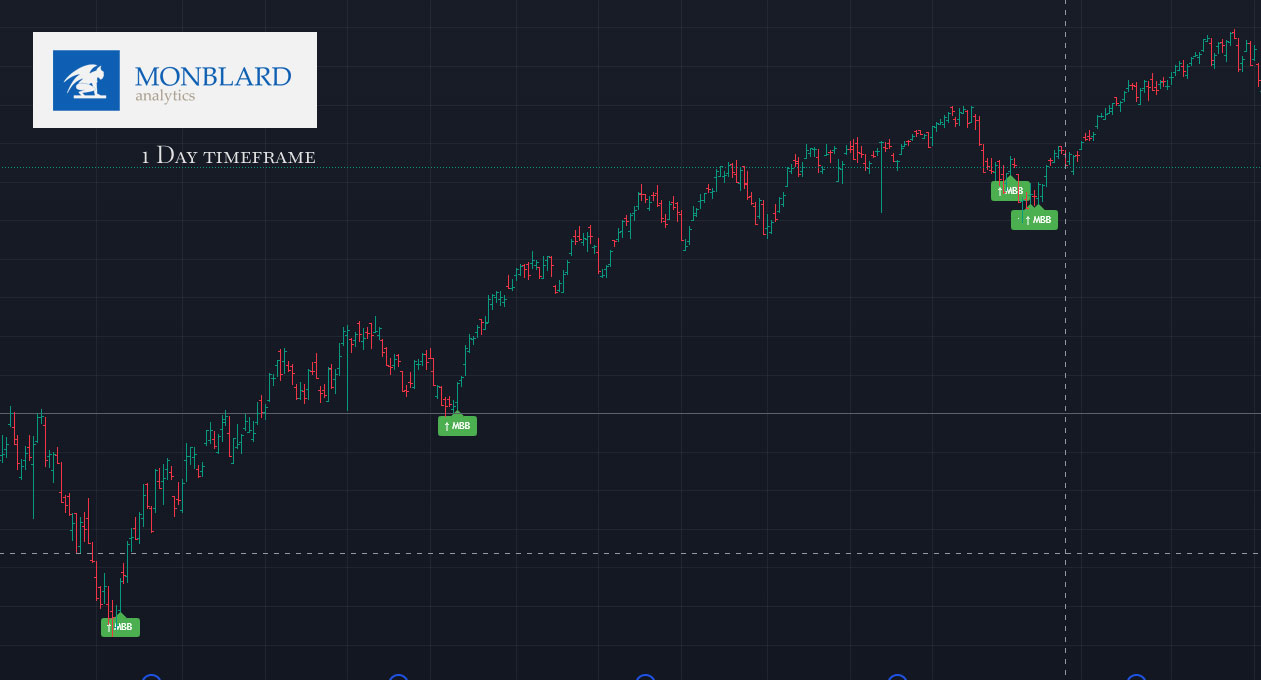
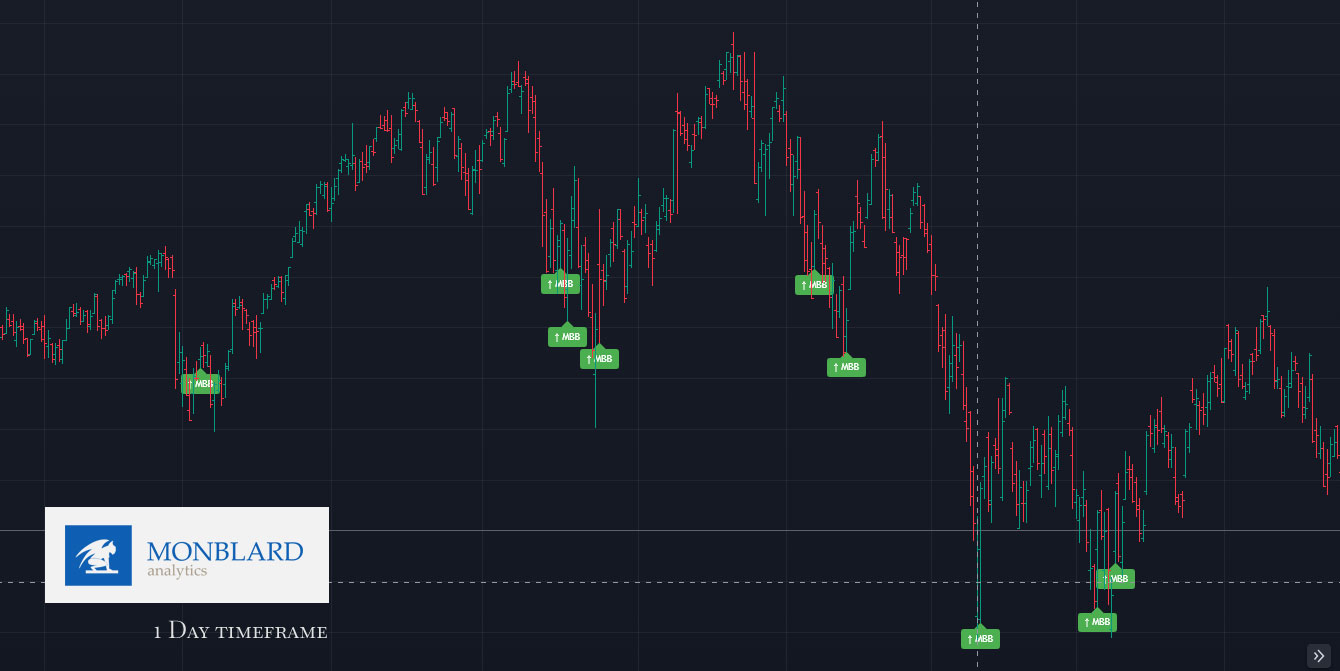
The Total Scan indicator scans the entire macro environment (it draws data from all 500 S&P500 stocks individually, not from the index itself, but from each stock separately)
Subsequently, it looks for significant statistical bottoms and the crossing of significant statistical levels downwards – not for the entire index, but for each stock individually!
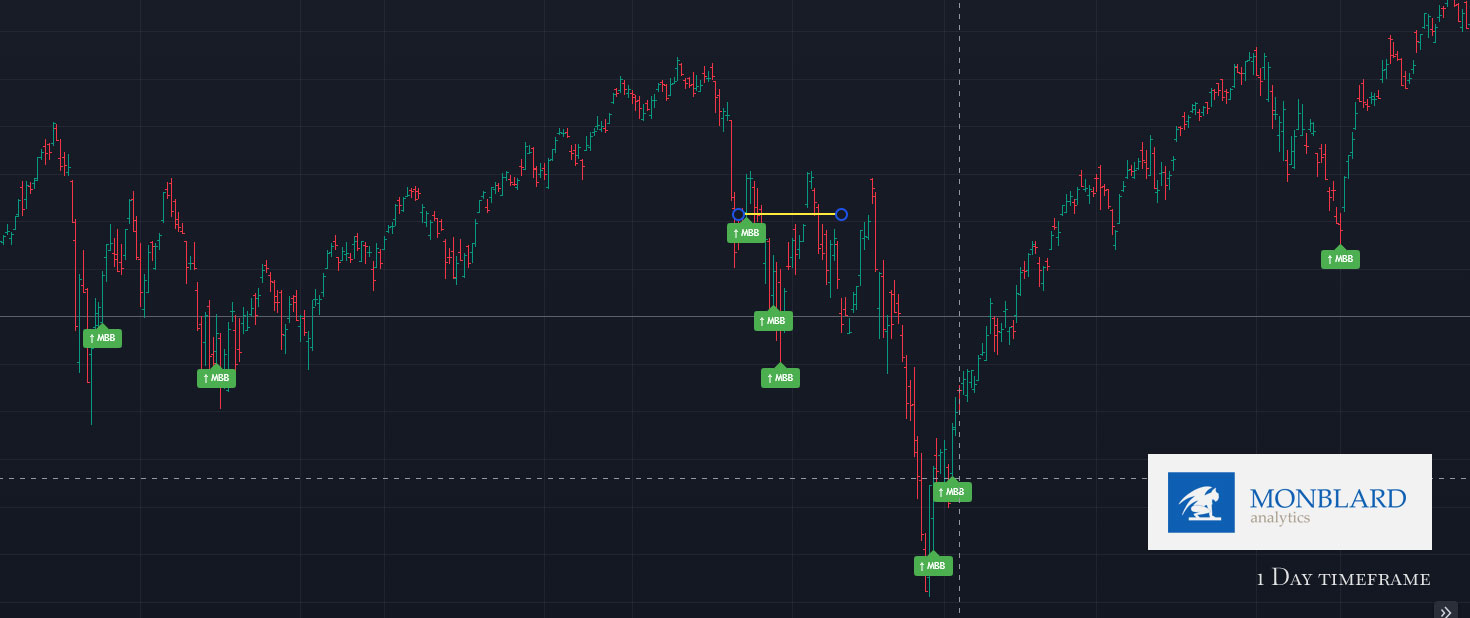
Subsequently, if the statistical expected bottom has been reached for more than 70-80% of shares from the entire index, detector 2 will be triggered. If Detector 2 detects an upward bounce from this statistical value (i.e. possible reversal and price growth), it will draw the MBB medium bottom mark.
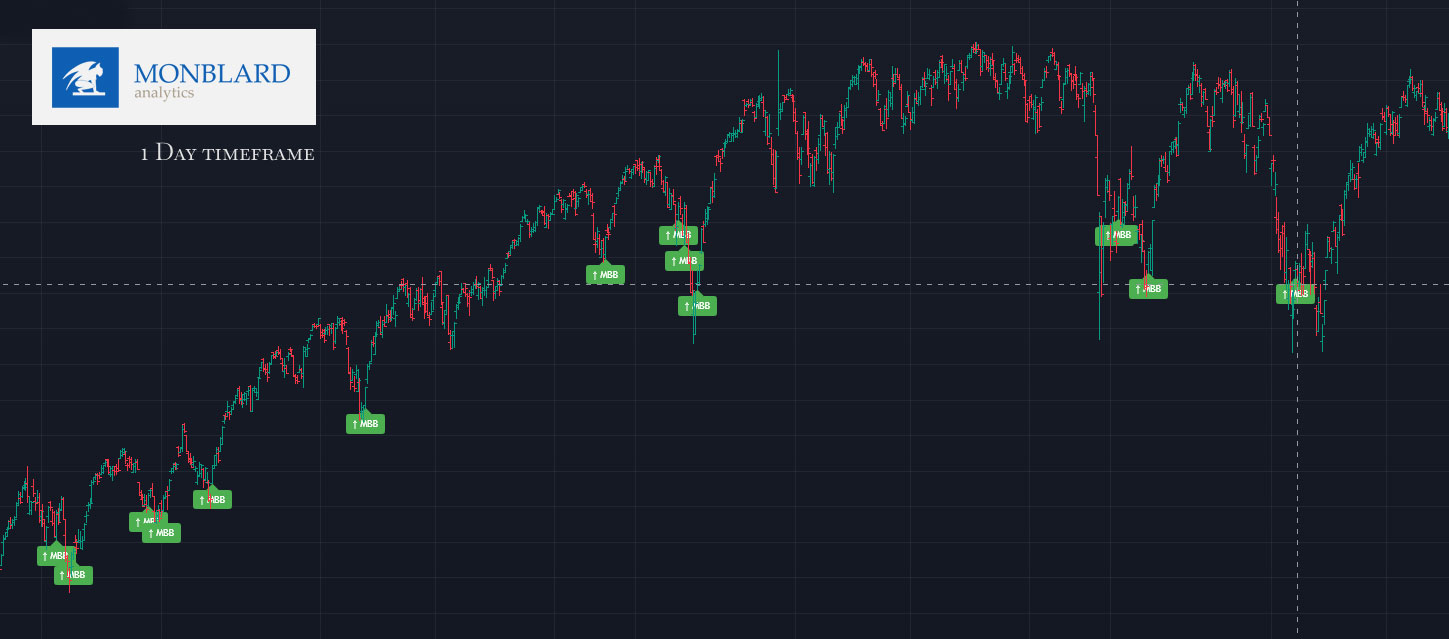
We (personaly) usually buy from this place if we manage to detect a possible reversal of the trend through other indicators. Often from this point the price starts to rise for a longer period and it is possible to start pyramiding, sometimes it happens that the price falls further if there is a strong correction or negative mood in the market. Usually, however, the price rebounds from this point the next day and creates at least a V spike upwards, if the strength of the bulls (and macroeconomic conditions) is not sufficient and they cannot push the price further, usually after the V spike there will be a slump, but not an immediate one, and usually we have the opportunity to get out of trade exactly before the place when we opened it and when the signal appeared – that is, with a miniature profit but not a loss – this makes the Total Scan indicator a very powerful weapon.
As you have surely noticed and as we teach in our membership materials, many mega cap stocks and blue chip companies are strongly correlated with the S&P500/Macro, therefore this indicator is very good not only for trading and investing in indices, but also as an excellent auxiliary indicator for trading / investing in large stocks. It is primarily suitable and best for the SPY ETF / S&P500 itself, but it can also be used for the Nasdaq 100 QQQ or DJI, which are quite correlated with each other.


How we use this indicator:
This is not investment advice or guidance. This artice is only for informational, educational and marketing purpose. We are not financial advisors just data/quant analysts. Read the full disclaimer below. These are just our personal experiences, which please take only as information and possible teaching/education.
You will read these things after purchasing the full version of the indicator:
How (personally) do we use the Next indicator and what do the other lines/graphics represent and how do we understand them? On what timeframe do we use the indicator? Do we use it solo or with other indicators? With what?
On what timeframe do we use the indicator?
What stocks/assets do we (only personally) use the indicator for? (not financial advice)
DISCLAIMER / INFORMATION:
Before using this indicator or any of our strategies, you must read our full disclaimer and agree to our terms and conditions – read them here (click).