pi-Synotic Bottom Finder 2H
This indicator tries to find potential mid-term and short-term bottoms of the stock price using not only one but several statistical/mathematical/algorithmic methods.

The green label bottom shows the finding of a significant statistical deviation from the imaginary short-term “equilibrium” in the time and price when the bears reached probable exhaustion.
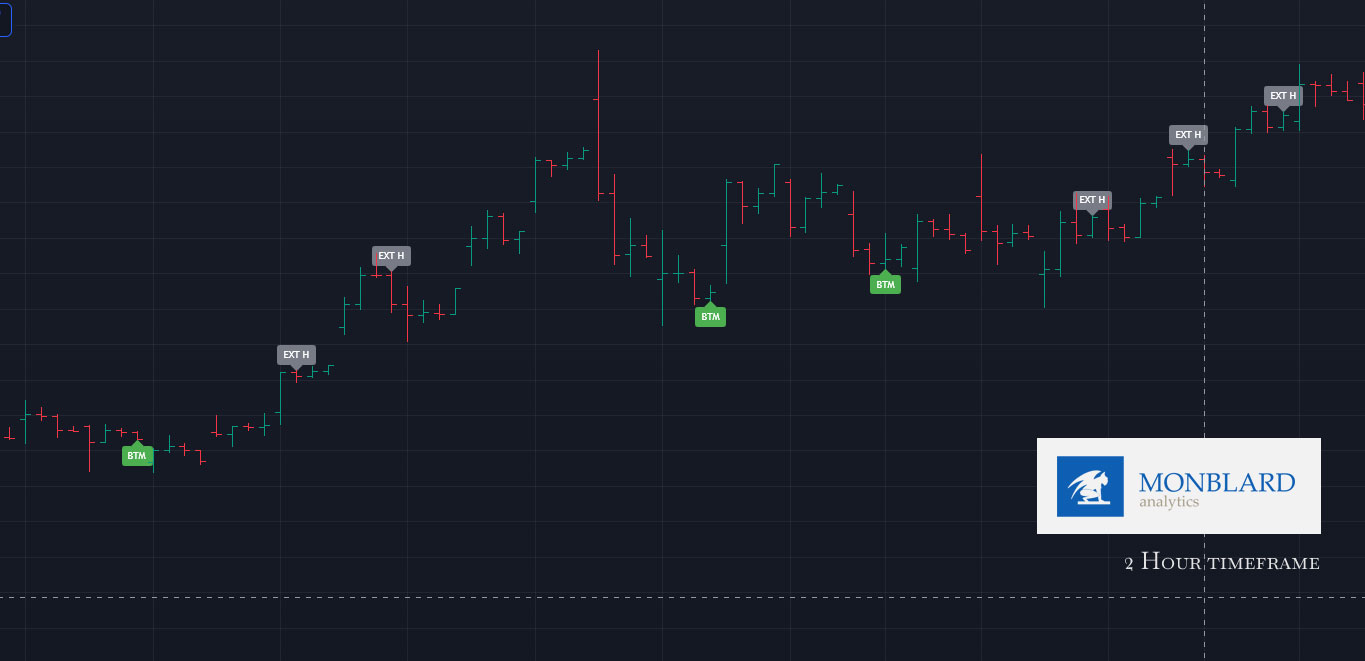
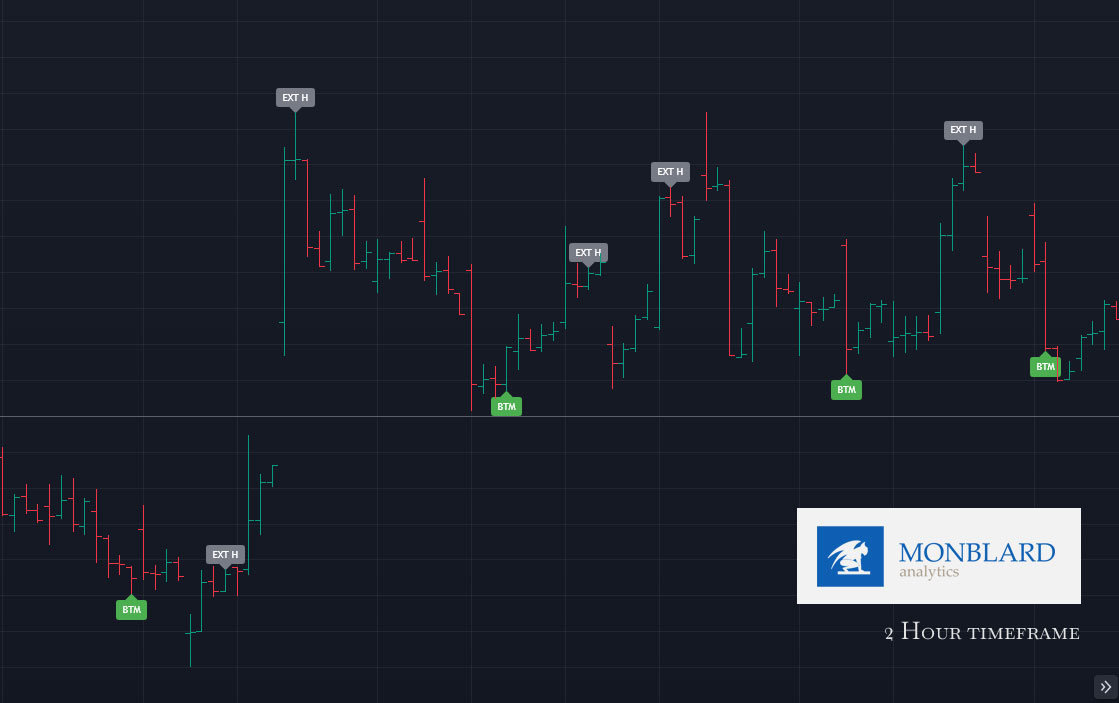
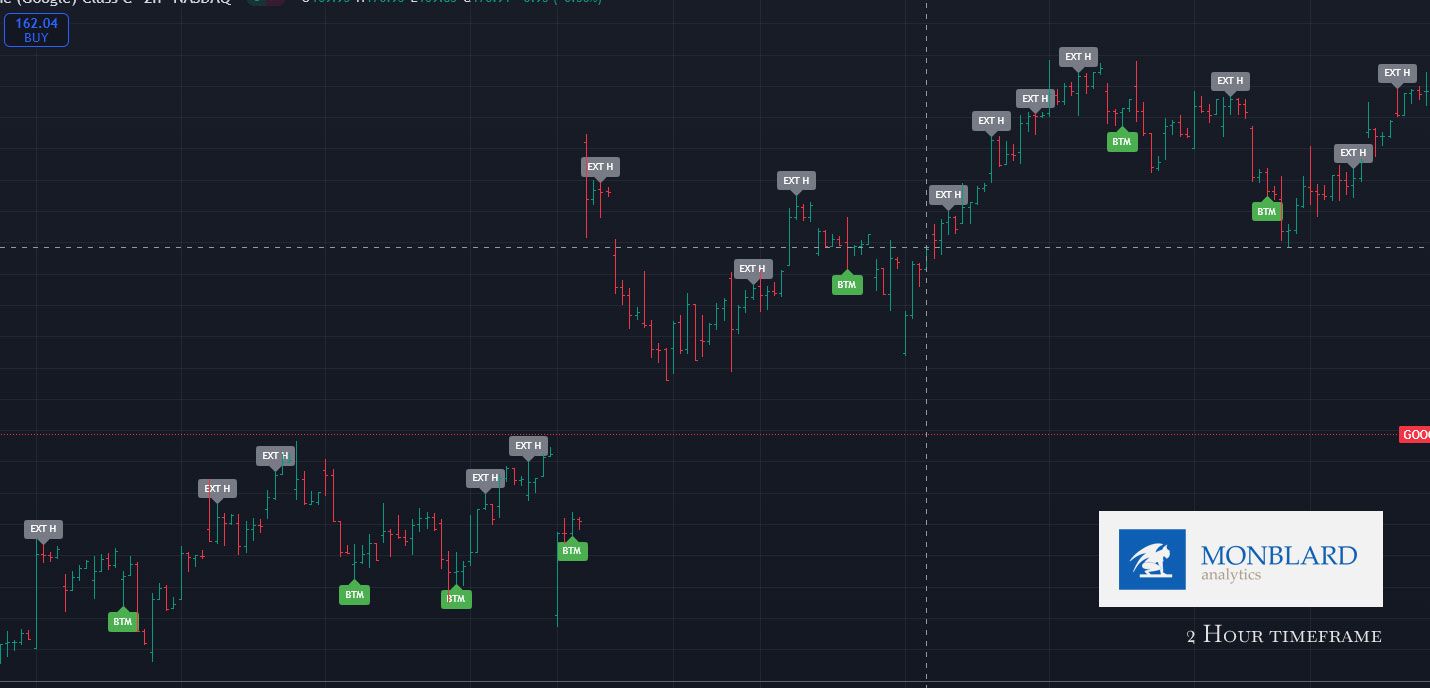
Ideal for so-called ping-pong trading, when the price is bounced up within the trend after a small correction and keeps going up and up. It can be used also for mean-reversion strategies. Use in combination with our other indicators (listed below and in our strategies – watch videos and membership area). Ideal for a 2-hour timeframe if the uptrend is also confirmed for a 1-day timeframe.

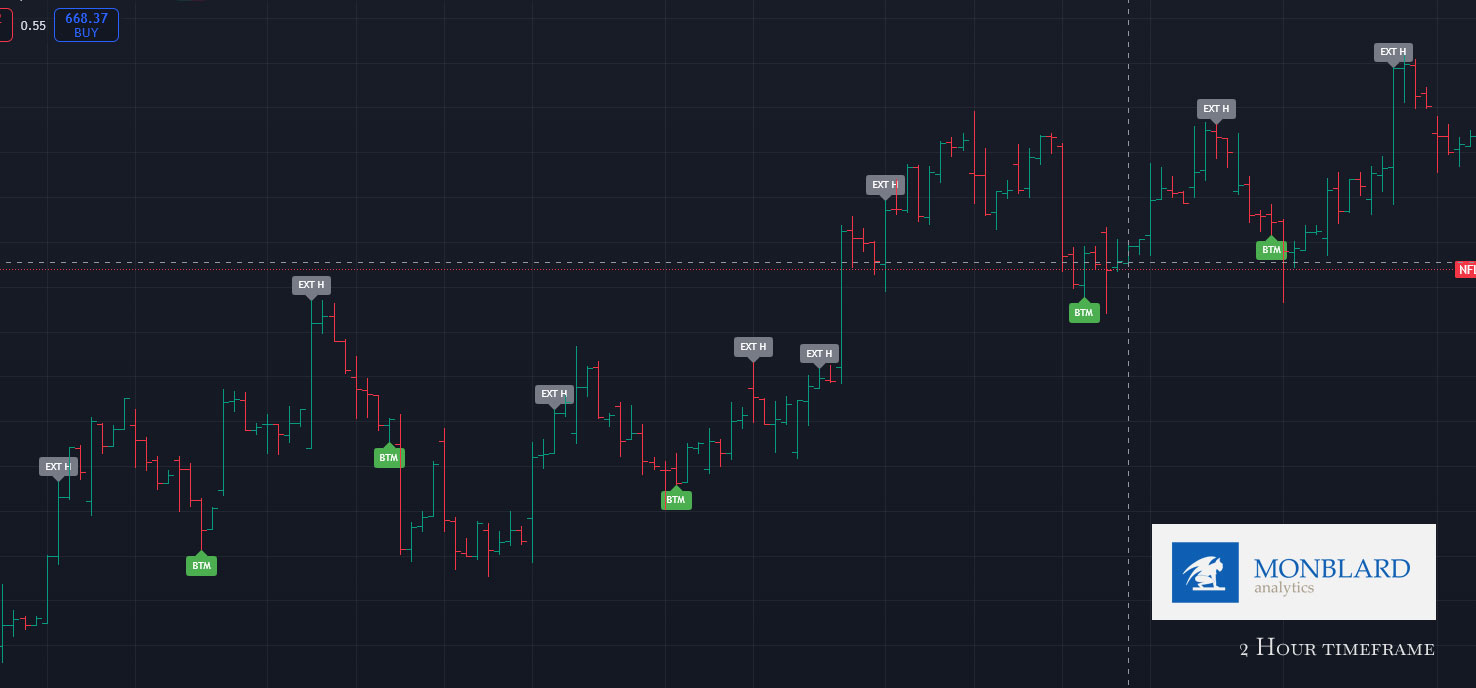
However, it should be taken into account that there can be several potential bottoms and tops of the market and bears (sellers) can overwhelm bulls (optimistic buyers who want to buy) and vice versa. No one knows the exact future, it is a statistical estimate. Therefore, it is necessary to help each other with other indicators and analyzes (explained below).
We are personally using also 2-4x pyramiding / splitting order between more orders if first bottom is not last.
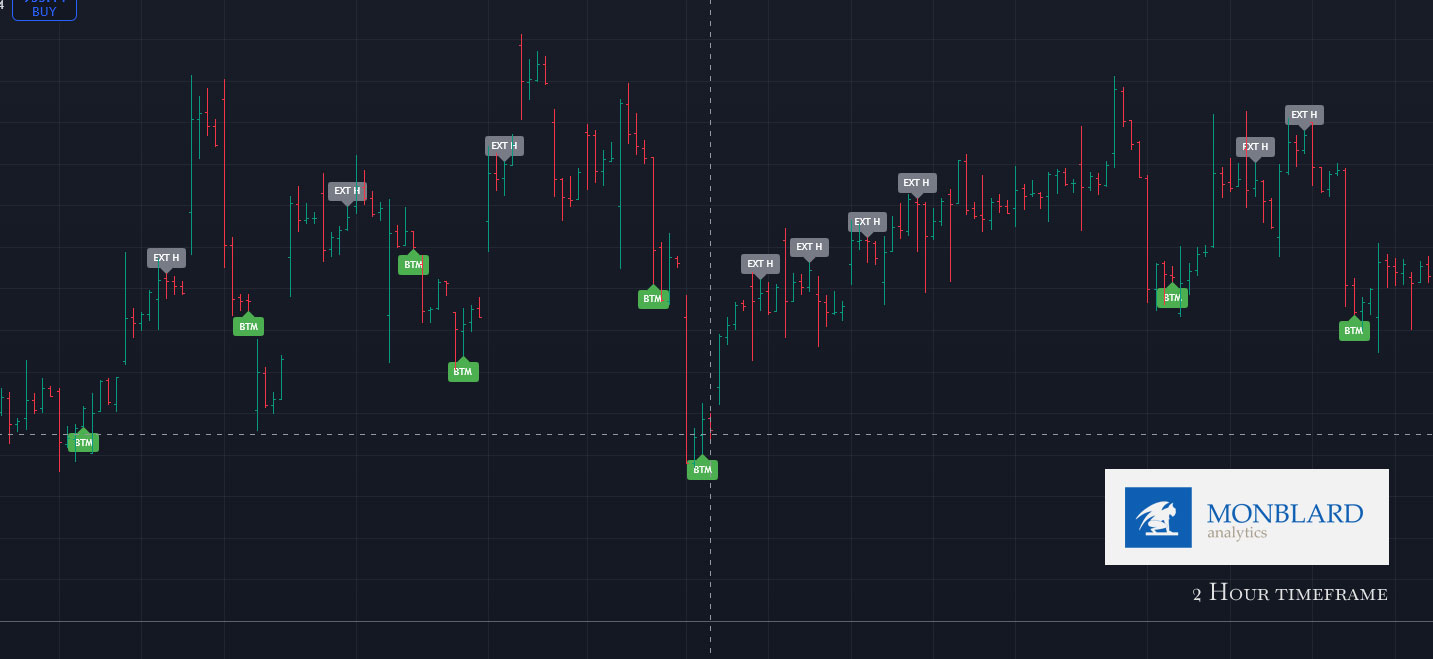
The gray Exit H button may represent a short-term peak, but of course the trend may continue further when bullish power overcomes it. That’s why we personally sometimes sell only a smaller part of the position in profit, it depends on the investment / trading horizon, strategy and setup.
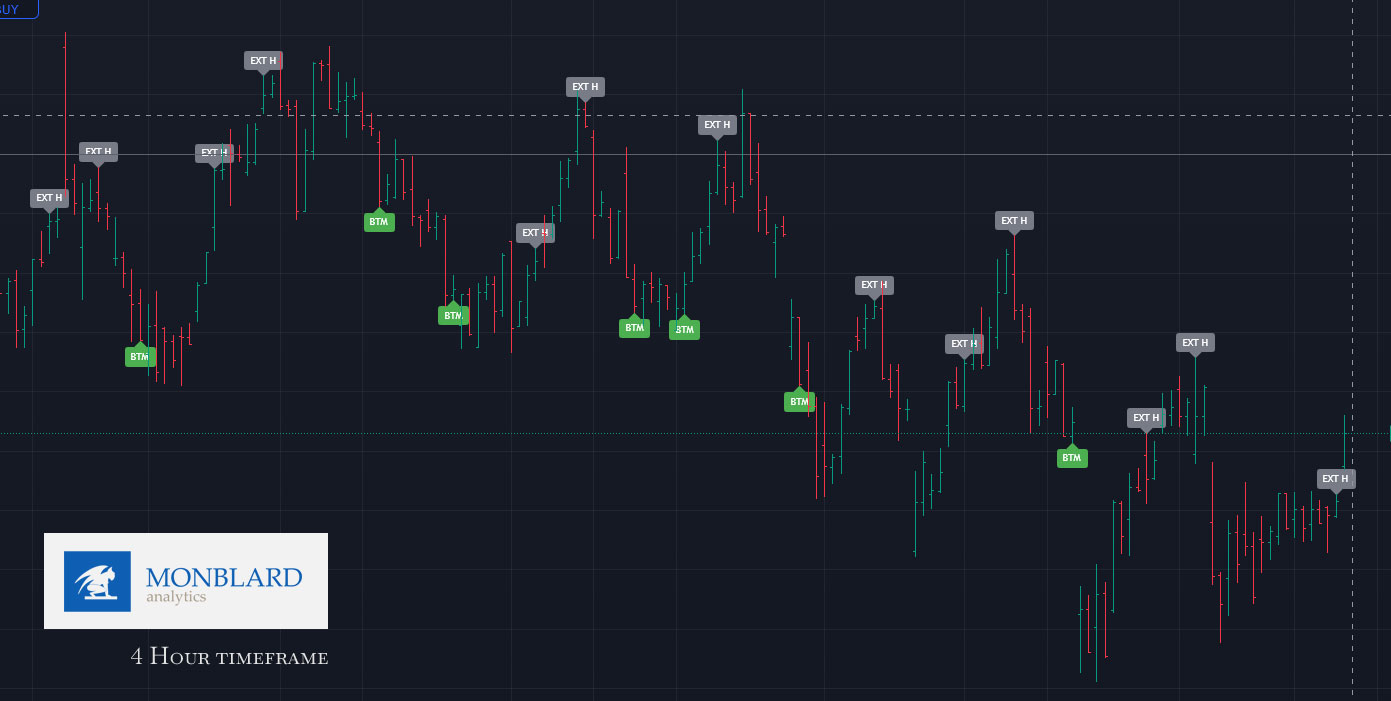
At the same time, we use pyramiding and divide positions into several parts, since it often happens that bulls break through and create 2-3 short-term bottoms. Of course, it is important to help yourself with the short-term indicator and follow not only the long-term 1-day trend, but also the 2-hour trend and the inflow of capital when the price overtakes its short-term trend – enter only when we feel and detect the end of the downtrend and the reversal of the short-term mini correction – pullback.
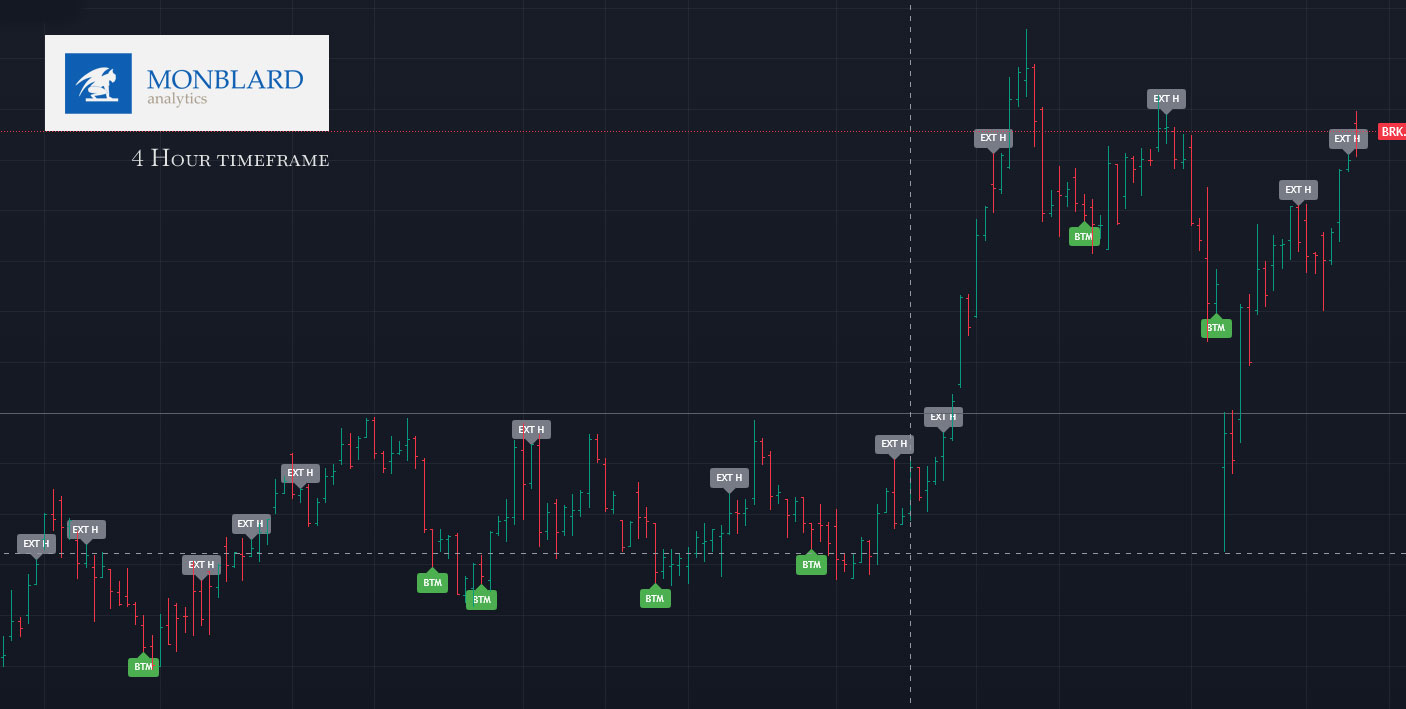
This indicator does not create repainting, which you can easily verify in replay test mode (testing repainting is a very important thing for every strategy, because if a strategy or indicator additionally draws points/labels on the graph, it means that it looks into the past and only informs about things that happened subsequently is very dangerous)


How we use this indicator:
This is not investment advice or guidance. This artice is only for informational, educational and marketing purpose. We are not financial advisors just data/quant analysts. Read the full disclaimer below. These are just our personal experiences, which please take only as information and possible teaching/education.
You will read these things after purchasing the full version of the indicator:
How (personally) do we use the Next indicator and what do the other lines/graphics represent and how do we understand them? On what timeframe do we use the indicator? Do we use it solo or with other indicators? With what?
On what timeframe do we use the indicator?
What stocks/assets do we (only personally) use the indicator for? (not financial advice)
DISCLAIMER / INFORMATION:
Before using this indicator or any of our strategies, you must read our full disclaimer and agree to our terms and conditions – read them here (click).
