Simulation of account development – trading equity chart (Monte Carlo simulation) at different Winrates, at different Risk per trade and at different Risk to reward.
Risk management, money management and position management are one of the most important things in trading and no less important than fundamental, macroeconomic or technical analysis.
Why is it important? Because you can never have a 100% winrate on the stock market (but not even in life, business or games, it’s not physically possible) and just a good risk and money management can turn your failed losing approach/strategy into a profitable one (but cannot save you if you have bad overall strategy, zero edge and loosing more than winning).
Many traders and investors do not understand the basics of risk and money management – not at all. At most, they will look at various tables, which, however, often do not correspond to reality. However, they have never done complex Monte Carlo simulations. The basic tables with numbers may not correspond to reality at all, because even a strategy with the same winrate and risk to reward can behave differently with a different sequence of trades (if we toss a coin, it can happen that one side falls 9 times in a row and the same is the case with trading ), so the fixed table does not represent the exact reality. So you need multiple simulations!
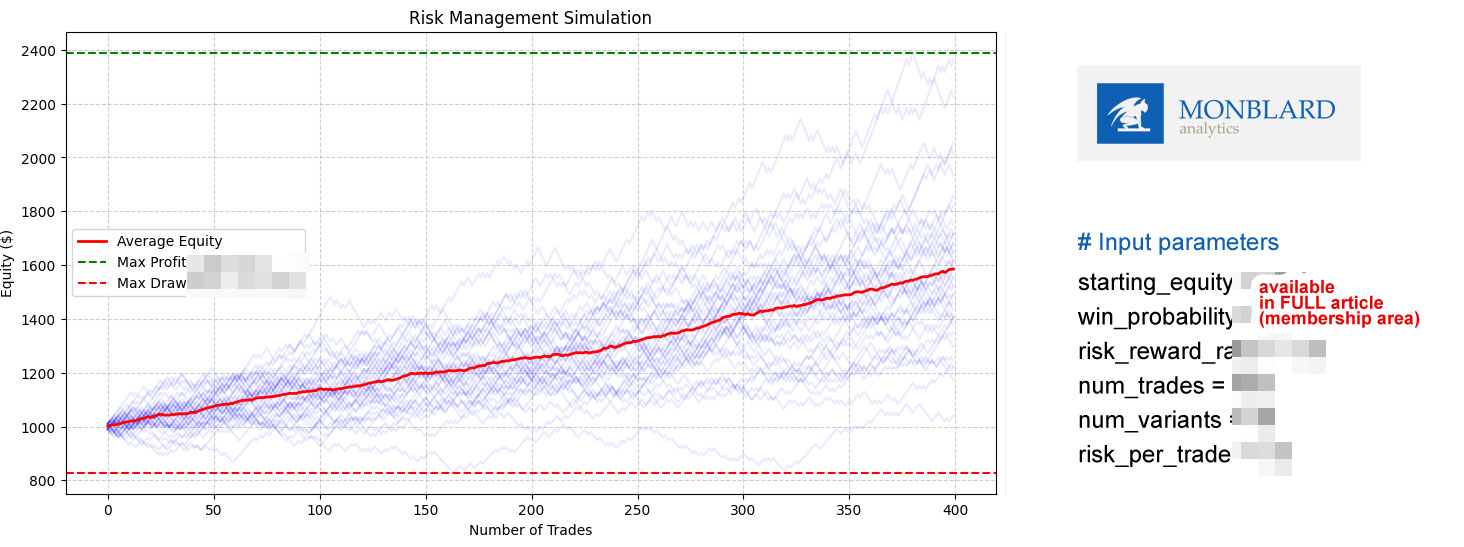
Monte Carlo simulations are needed, which will create several random courses – we will immediately visually determine that a strategy with the same winrate and risk to reward can be highly profitable at one time, less profitable at another time, and even slightly lossy at another time with a certain sequence of wins and losses. However, it is important to know the statistics and look at things from a greater distance, so that we do not withdraw from a profitable strategy just because of a temporary losing period. Casinos also do not look too much at daily profits and losses and do not change their strategy based on one or two losing days, because they know that they have a system mathematically calculated and analyzed on graphs/simulations so that they – the casino – will definitely win in the long run. They use the so-called theory of large numbers. In the simulations, you will see that certain ratios of profits and losses, risk to reward and % risk of capital are almost always profitable and even if they go to loss in certain periods, you simply have to wait because you have a statistical edge . You will also see that with certain winrate ratios , risk to reward some strategies are almost always loss-making, or that even strategies that are profitable can suddenly become loss-making with an inappropriate size of risked capital for one trade – that is, a profitable strategy can become a bad position /risk management change to loss. A simple table where you can see at what winrate, RR and % risk you are profitable and losing is not enough, you need to see graphs and simulations, because in reality it will not always behave the same in all periods as shown in the table – but multiple Monte Carlo the simulations are very similar and almost identical to reality, because the coin/dice is tossed multiple times and multiple simulations run in parallel.

What is Monte Carlo simulation and why is it important ?
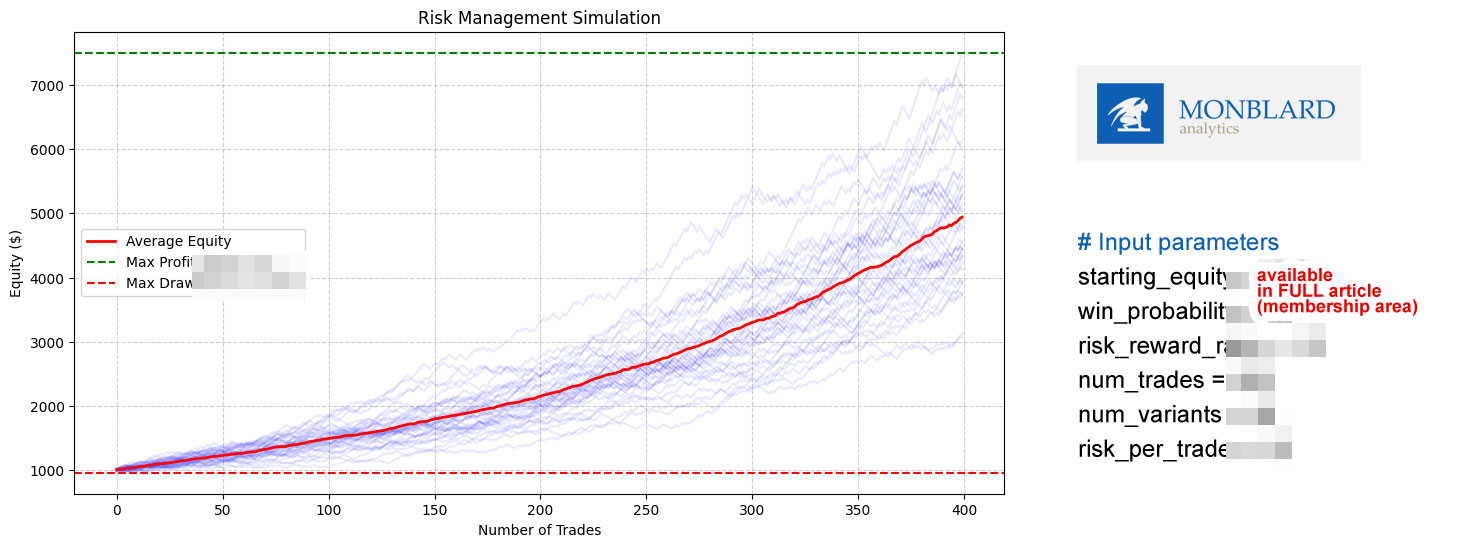
Imagine that you have a strategy with a 55% winrate , risk to reward 1:1.2 and you risk 3% of capital per trade (meaning after applying stoploss, not that you only open trades in the size of 3% account but the maximum loss can achieve 3% of your bank/account)
Now imagine that you are flipping a coin and one side is a winning trade and the other side is a losing trade. With different series of throws, the winning and losing sides will fall to you in different orders, 3 loss 5x win, 7x win, 5x loss and so on, although as a result the winrate will always be the same 55%, it can still happen that a series of throws appears when you reach 14 times a loss. Even a real-life story: The longest recorded losing streak in roulette is 32 consecutive losses on red or black. This streak happened at a casino in Monte Carlo in 1943. Such long streaks are very rare, but they show how unpredictable roulette can be. And you have to remember that the win rate in roulette is always about 48%.
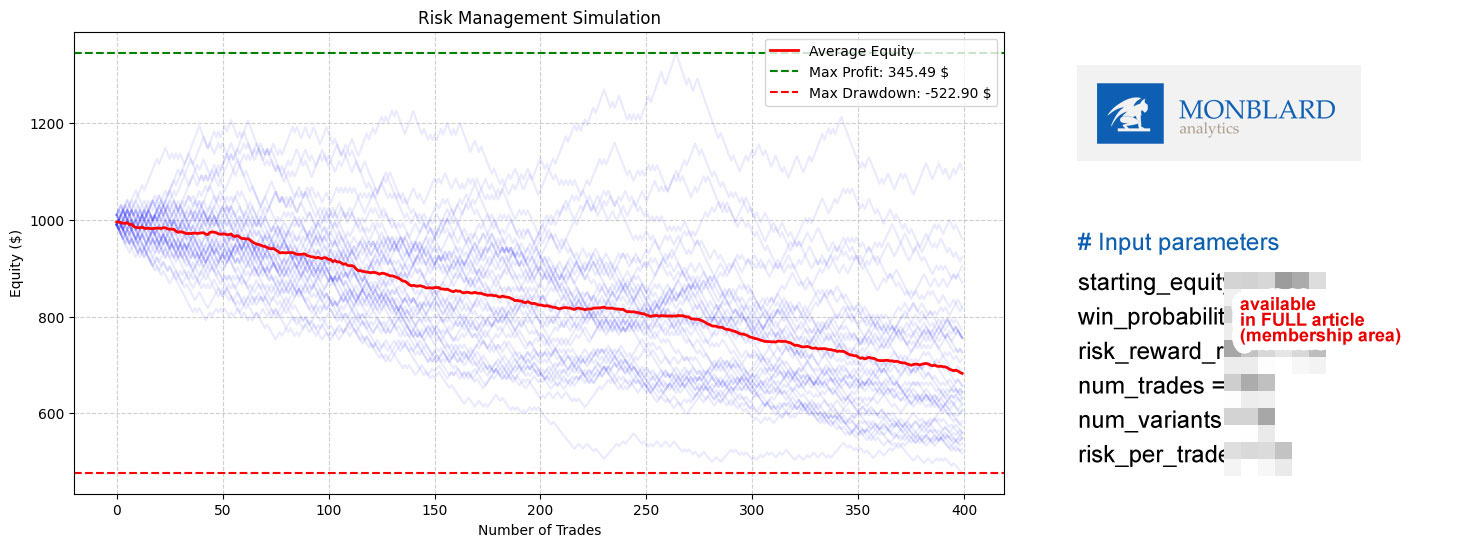
If we used inappropriate risk/position management and risked too much on the account, it could happen that with a series of 32 losses we would simply wipe out the entire account, but nevertheless, if we had a well-set money management and would persevere in the end, we could to be profitable (not in roulette because there you have a 48% winrate and a risk to reward of 1:1, but the casino has 2×0 when it takes the entire bank) but on the stock market – that is, if we had a winrate of only 48% but a winrate better than 1:1.3 we can win .

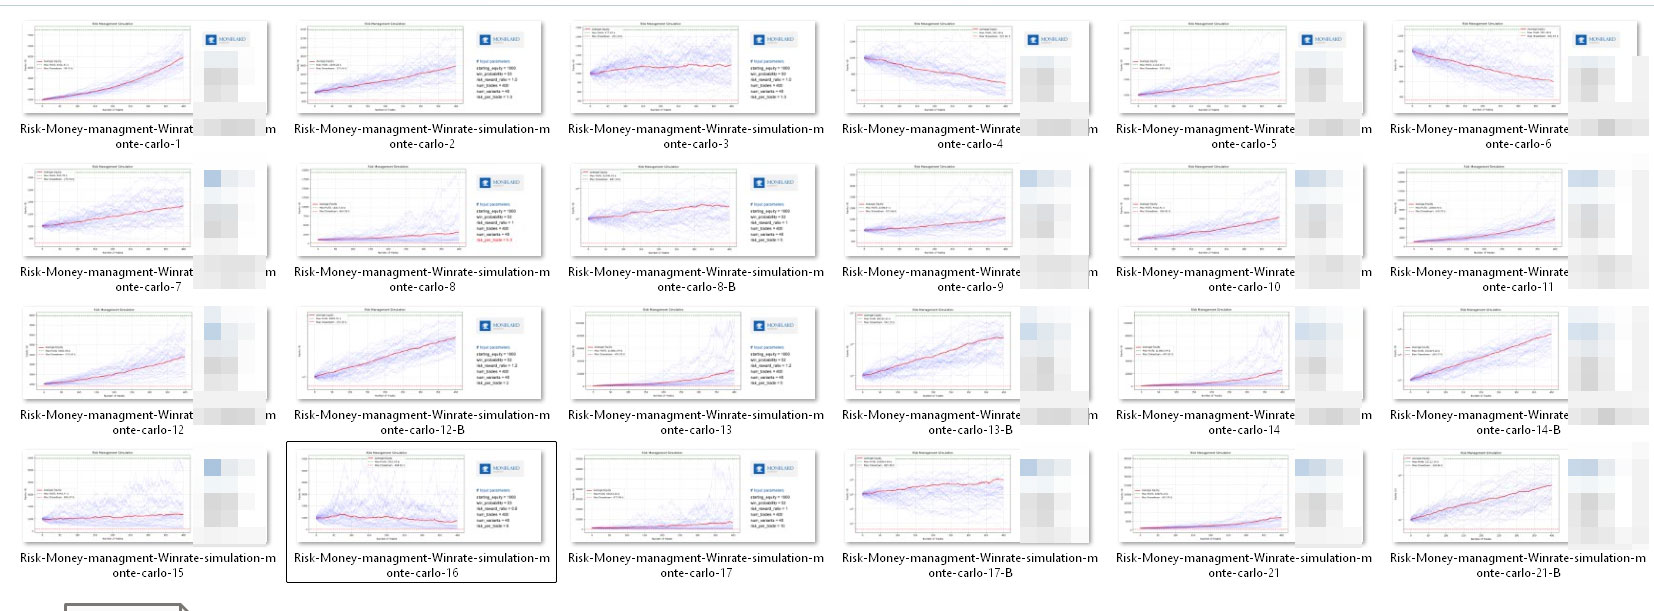
It’s better to see once than to hear or quote 100 times – that’s why they have prepared a series of dozens of simulations for you with different wins with different risk to reward and different % risk to account.
In a series of articles we will show you: account simulations with winrate probability 20%, 30% 45%, 50%, 52%, 55%, 60%, 65% risk to reward 1:1.5, 1:1.2, 1:1, 1: 1.8, 1:3 risk per trade 1%, 2%, 5%, 6%, 7%
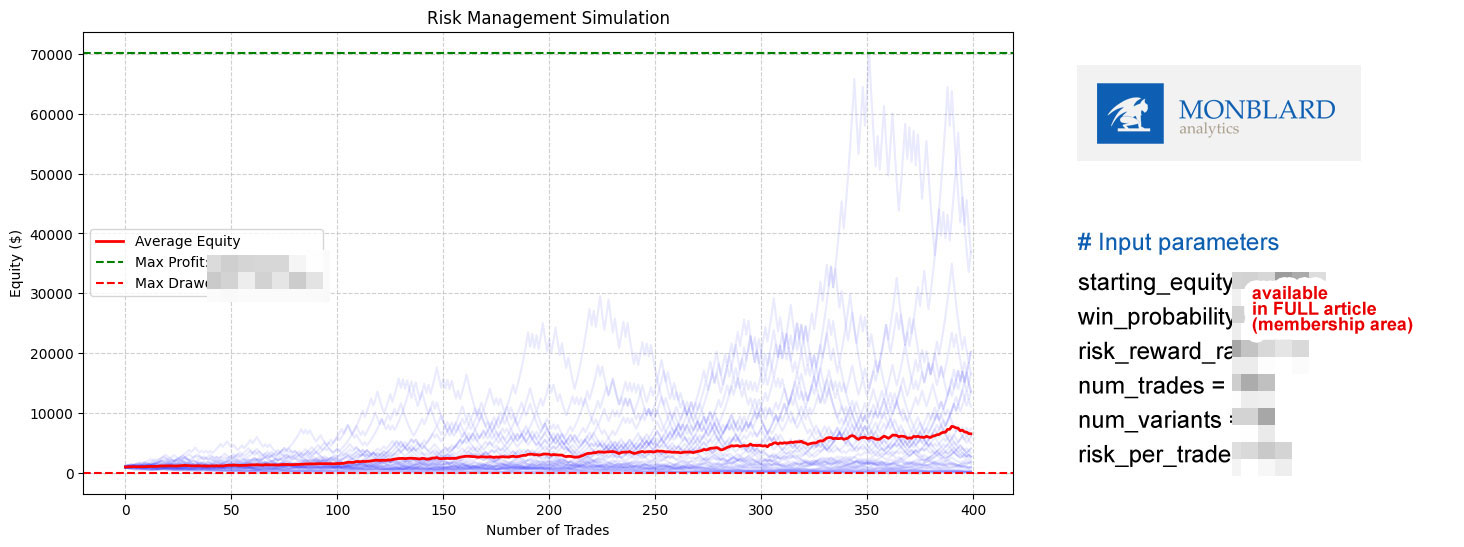
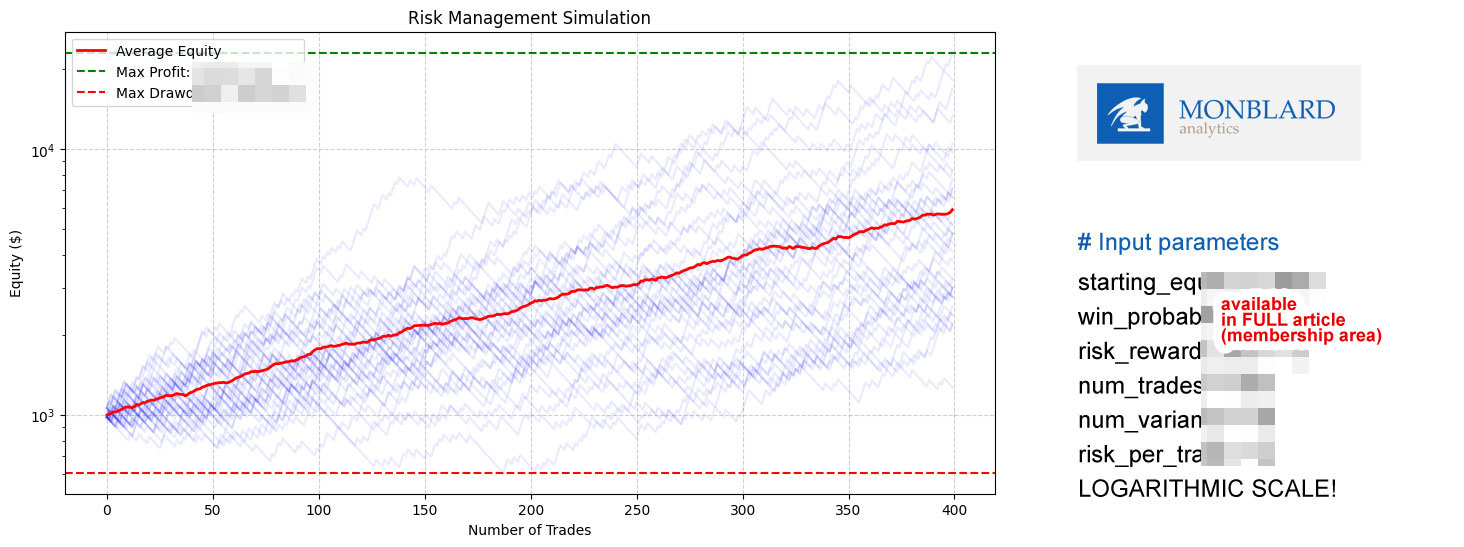
We will also show the simulation on a classic and logarithmic graph so that it is better, to see on highly profitable simulations also periods when they could go partially to a loss
In the next parts so let ‘s explain what it is:
starting_equity = 1000
win_probability = 55
risk_reward_ratio = 1.5
num_trades = 40
num_variants = 40
risk_per_trade = 1.0
we will explain what are blue lines, red thicker line etc.
But mainly we will show more than 29 multiple Monte Carlo simulation created in the Python coding environment.
The story continues… READ MORE:
The entire article is available to members of our club. Join our private membership area:
Private membership club / Area with premium articles (Click here)
